Q&A: Gathering Data
As the threat landscape has changed, security leaders have had to adapt. It is infinitely important that the leaders responsible for safety and security on university and healthcare campuses comprehend and strike a balance between needs versus wants as they build their programs to respond to changes. In this four-part Q&A, learn how four security leaders in healthcare and education tailor security programs and expectations using data, outreach, and partnerships.

←Introduction
Our personal and professional lives are becoming increasingly analogous to a boat drifting through a vast sea of innumerable data points. Making sense of it all requires focus, cooperation, and a fair degree of patience. In this section, Frank Spano, John Dailey, Bonnie Michelman, and Lisa Terry discuss the value of data, what data should be collected, capability multipliers within and outside the organizations, data interpretation, and what to do when data sets do not agree.
Why do we need to collect data, and what data do we need?
Frank Spano: Is there such a thing as too much data? Perhaps. Though one might argue the critical distinction is that of data versus intelligence. The former being raw information, while the latter is information refined through analysis and application into something of particular value to the organization. In a world of seemingly never-ending data, our challenge lies in the effective consolidation, analysis, and interpretation of that raw information into something of value to the campus community. As mentioned previously, campuses collect all manner of data, and often employ individuals or entire divisions to do institutional research. Thankfully, the somewhat natural inquisitiveness inherent in academia provides a significant leg up when it comes to data collection and analysis.
But what’s actually important? It depends on the organizational goal to be measured. For some applications, such as regulatory or accreditation reporting, event data and raw statistics are satisfactory. In other cases, such as the evaluation of key performance indicators (KPIs) related to organizational or programmatic goals, raw statistical data would prove insufficient absent additional analysis and application to the specific situation relevant to participation, application, and outcome.
John Dailey: We need data to make a real impact on the problem. Through analysis, we can develop targeted approaches. For example, reducing workplace violence is an imperative goal in healthcare. A targeted strategy might be to understand and reduce the number of times patients hit staff—this requires data.
Lisa Terry: Collecting and analyzing appropriate data is an essential piece in building and expanding a quality healthcare security program.
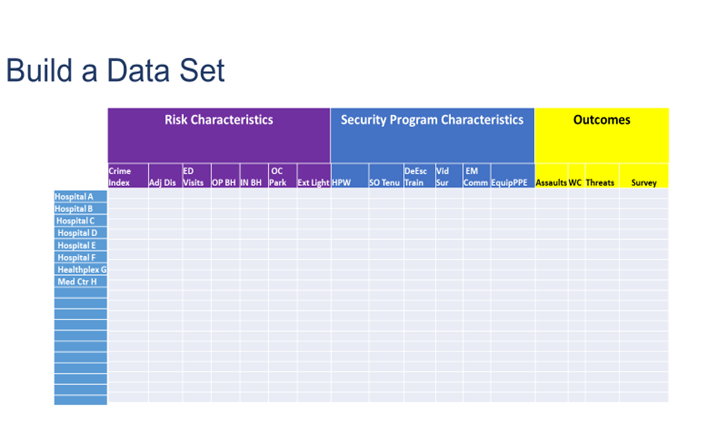
To better pinpoint the key pressures or drivers relating to security incidents, it is important that the data collected be relevant and current. In building the data set from which to collect the information (compare and analyze over time), there are three areas to be considered. It is also advantageous if you are able to compare multiple facilities at once. I took recommendations from an article written by Katherine Eyestone and Shon Agard, MS, CHPA, in the Journal of Protection Management in titling the data set:
- Risk Characteristics (community crime rate, CAP Index, ED visits, etc.). These are characteristics that affect security but over which the security leader has no control.
- Security Program Characteristics (hours per week, de-escalation/non-escalation training, visible video surveillance, visible emergency communication system in parking areas, equipment/PPE,). These are characteristics that affect security which the security leader has control of.
- Outcomes (Worker’s compensation claims, assaults including hits, kicks, bites, spitting, and threats, etc.). Measurements of impact over time.
A simple spreadsheet, similar to the example below, allows you to document the chosen risk characteristics, the security program characteristics, and the outcomes from each healthcare facility for which you are responsible. Once you have a snapshot of your entire system, you are better prepared to review your security program over time and perhaps make changes as necessary to affect the outcomes.
Where can we get the data within our organization and outside our organization?
Spano: Perhaps the most consistently recurring conversation I have with campus leaders revolves around the all-too-real notion of campus communities being divided into various silos: academic, athletic, administrative, etc. Though I’d like to tell you this only exists in enormous academic institutions with large standalone schools and programs, it seems to be the case even in the most seemingly tightknit small-footprint institutions.
Unfortunately, this has a tendency to lead to difficulty in capturing accurate data—or data at all—from across various silos. Often, information is withheld or otherwise massaged so as to cast the respective silo in the best light prior to submission. Unfortunately, this poisons the data set and artificially skews results. For this reason, campus communities are well served in identifying and empowering a cross-functional team led and supported by external facilitators to collaborate across silos to create an environment conducive to obtaining the most relevant and un-edited data for analysis and application.
Bonnie Michelman: From an internal perspective, data can be obtained through incident reports, quality and safety reports, occupational health reports, and other mechanisms set up to capture whatever activity and data within the organization.
Outside agencies and companies can provide great supplementary and complimentary data as well. Having a report done of the crime risk at facilities you own or lease offers you a clearer picture on what type of security you need. Getting data and/or trends from regulatory or accreditation agencies and using professional organizations like the International Association of Healthcare Security and Safety (IAHSS) or ASIS International can offer guidance, standards, and great data, such as the IAHSS Foundation's Annual Crime Survey.
Collecting information on negligent and inadequate security litigation across the country can help you ensure you are avoiding the prevalent risks and utilizing reasonable standards and practices in your operation.
Finally, benchmarking with other colleagues in your industry and others can offer great insight and data to help you formulate plans and make decision.
Terry: In addition to internal department incident reports, organization risk, and quality and safety reports, comparative data may be obtained from the ED or behavioral health unit on number of visits, as well as the finance department, on the number of adjusted discharges. External data may be obtained from the U.S. Department of Labor’s annual reports on occupational injuries, illnesses, and fatalities based on the industry. Other associations such as the American Hospital Association (AHA) and IAHSS release regular studies on violence in healthcare.
How can we interpret the data we get? What does it mean? How does it affect what we want?
Spano: As there is a broad range of data sets applicable to campus communities, so too is the wide spectrum of interpretation methods. While largely driven by outcome requirements—such as annual security reporting (ASR) accreditation, and reaccreditation evaluations—data interpretation can range from simple reporting to more complex analysis involving end-user feedback surveys, data compilation and assessment, and increasingly electronic statistical analysis.
Dailey: An example of our use of data can be found in our response to propped door alarms throughout campus. A significant number of doors throughout the university are controlled by electronic access control. In 2017, we had more than 28,000 propped door alarms. That’s an extremely high number. Each of these alarms required a security response and report back as to status. Many times, the door was secure by the time the response occurred.
Though we had hoped to find a pre-existing proven plan elsewhere that could work, we ended up having to build our response from scratch. We established a cross-functional team consisting of public safety and university information technology personnel to look at the data, the time at which each alarm occurred, the length of time each propped door was unsecured, the acceptable time threshold for each propped door, and the response time to get there.
From there, the team drilled down into the data set, divided the doors into various levels of priority, and made recommendations on how best to structure response operations for each priority level.
For example, the door to a classroom within a building may be a lower priority—particularly after business hours—than the door to a residence hall where people live or congregate on a more 24/7 basis. This data-driven process allowed us to balance security needs against operational needs, and resulted in a drastically reduced call volume down to approximately 19,000 propped door alarms the following year.
The team continues to provide data assessment and analysis year-over-year to ensure we are responding effectively.
The cross-functional team allowed us to reprioritize an unsustainable issue, identify reasonable solutions, and implement meaningful response.
Michelman: The department should have people who are trained on data collection, analysis, and trends. Some have an intelligence resource within the department or the investigative function. Reports that are data based need to be compiled monthly and yearly to show trends to help with investment of security equipment, staff, and technology, along with resource deployment.
Plans and strategies need to be continually adjusted based on data analysis and trends being seen. If there is more violence in the ED on weekends or a particular shift during the week, operational changes should be made. If intrusion or piggybacking is happening on particular doors or areas, better surveillance and training of those in the area has to occur.
It is important to discern nuances such as higher reporting due to increased training, which could skew actual incidents and risk. Your security staff needs to be able to capture very thoroughly in incident reports any specific factors that point to causation or a change. This is critical for planning.
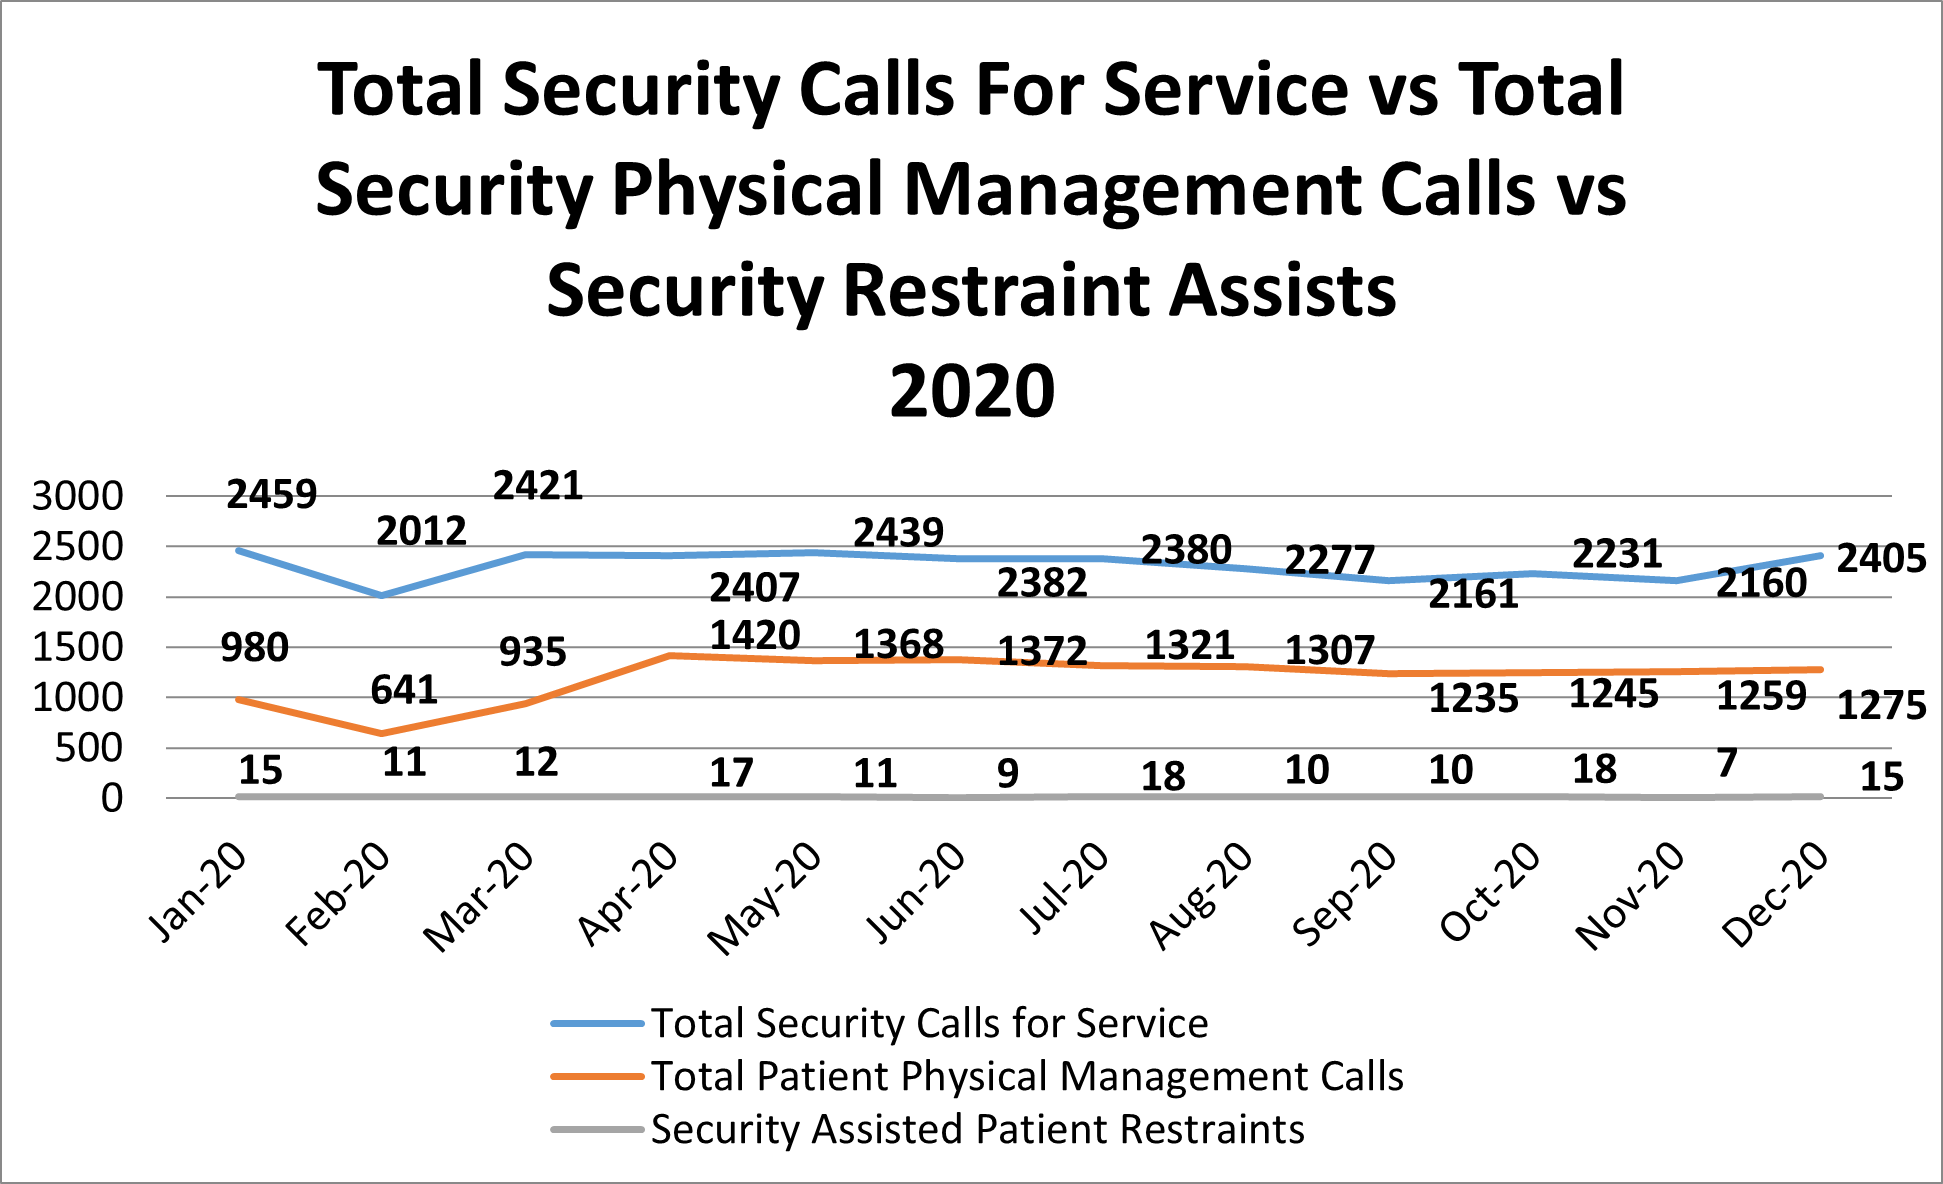
Terry: As an example of how data can be analyzed, in the chart below Hospital B continues toward the goal of a restraint-free environment, the number at the bottom of the graph remains at a constant flat line. However, approximately 50 percent of the “Total Security Calls for Service” involve some type of physical management or intervention for patients by security. Fewer patients are being physically restrained. However, there are still a high number of physical management situations in which the security department is involved due to a high level of clinical aggression. This data analysis allows us to determine the importance of ongoing monitoring of this type of activity to ensure that adequate training and staffing are being conducted for the security officers.
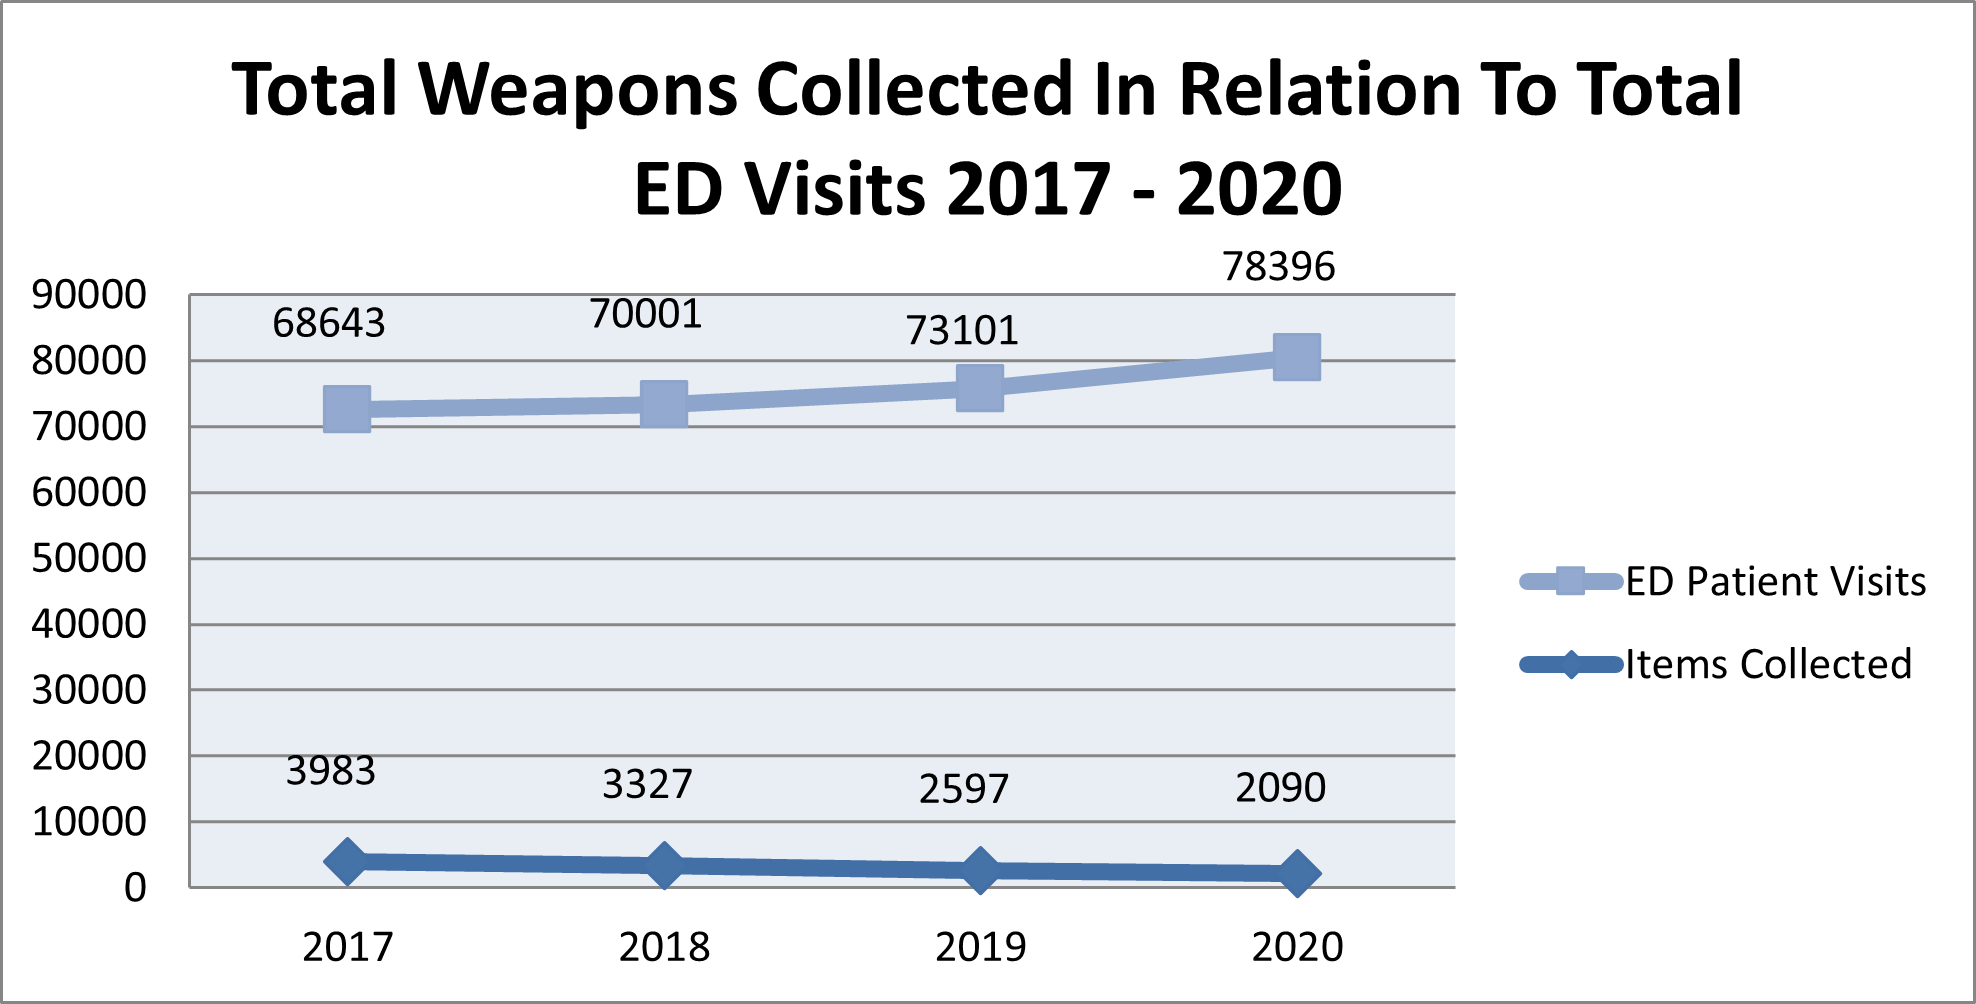
It is very important to compare data over time, to include years. For example, the initial hypothesis at Trauma Hospital A was that with more patients being seen in the ED, there would be more weapons collected at the magnetometer. However, as shown in the graph below, the numbers showed a substantial decrease in weapons collected each year. Upon further examination, it was determined that many of the individuals who visited this ED had visited it in the past (more than once). These individuals liberally shared the fact that the ED was equipped with a standalone magnetometer, deterring individuals from entering with a weapon.
What can we do when the different data sets don’t agree?
Spano: My college statistics professor once told our class that the best thing about statistics is that with the right calculations, the data outcome can be whatever we want it to be. If this is true—and experience tends to indicate it may be at least partially—then campus community leaders have a twofold obligation as to data analysis and interpretation.
First, an obligation to the data itself in taking all necessary precautions to safeguard the validity and accuracy of the outcome rather than falling into the trap of data manipulation. Second, an obligation to trust the data process insofar as doing so will provide the most accurate—if not always rose-colored—data to frame program assessment and future planning. If we adhere to these two obligations within a collaborative environment, data set disagreement should be greatly mitigated. That said, in the event disagreement persists, it may be necessary to enlist the support of a third-party in providing investigation, collection, and analysis support to identify the most accurate data set and outcome picture available.
Michelman: If data sets do not correlate, a deeper dive into the data with others needs to occur. Determine common definitions and good training on ways to submit data then ensure a constant crosswalk with other data sources is being done to determine consistency and accuracy. Often issues that complicate this are a difference in definition of incident or event, or ambiguity about when or who to report something to. It may require changes to your software program to ensure consistency and reliability of data.
Terry: I recommend that regular audits are conducted for all of sources of data to maintain its legitimacy and accuracy. If the data is being compiled within the security department, it is important that objective, specific written procedures are followed in obtaining and analyzing the data.